Monitoring Requests to API dv.net
Overview
The application interacts with the api.dv.net server to implement additional features, including:
- 📧 Sending email notifications without the need to set up your own SMTP server
- 📱 Telegram notifications for real-time alerts
- 📊 Collecting statistics and telemetry for system performance analysis
- 🔄 Software version control
Security and Privacy
Important: We guarantee the complete security of your data. When interacting with our API, the following is never transmitted:
- Seed phrases
- Private keys
- Passwords and secret data
- Any other information that could lead to loss of control over wallets or accounts
You can independently verify the security implementation by examining the project's source code:
https://github.com/dv-net
Enabling Advanced Logging
Configuration Setup
Add the log_status: true parameter to the admin section of the configuration file:
yaml
# /home/dv/merchant/configs/config.yaml

admin:
  log_status: true
  # other admin section parameters...
Service Restart
After modifying the configuration, restart the service to apply the changes:
bash
sudo systemctl restart dv-merchantViewing Logs
Method 1: Command Line (journalctl)
Use the system journal to view API request logs:
bash
# View all API-related entries
journalctl -u dv-merchant | grep 'DV-API'

# Real-time monitoring
journalctl -u dv-merchant -f | grep 'DV-API'

# View entries from the last hour with timestamps
journalctl -u dv-merchant --since "1 hour ago" | grep 'DV-API'
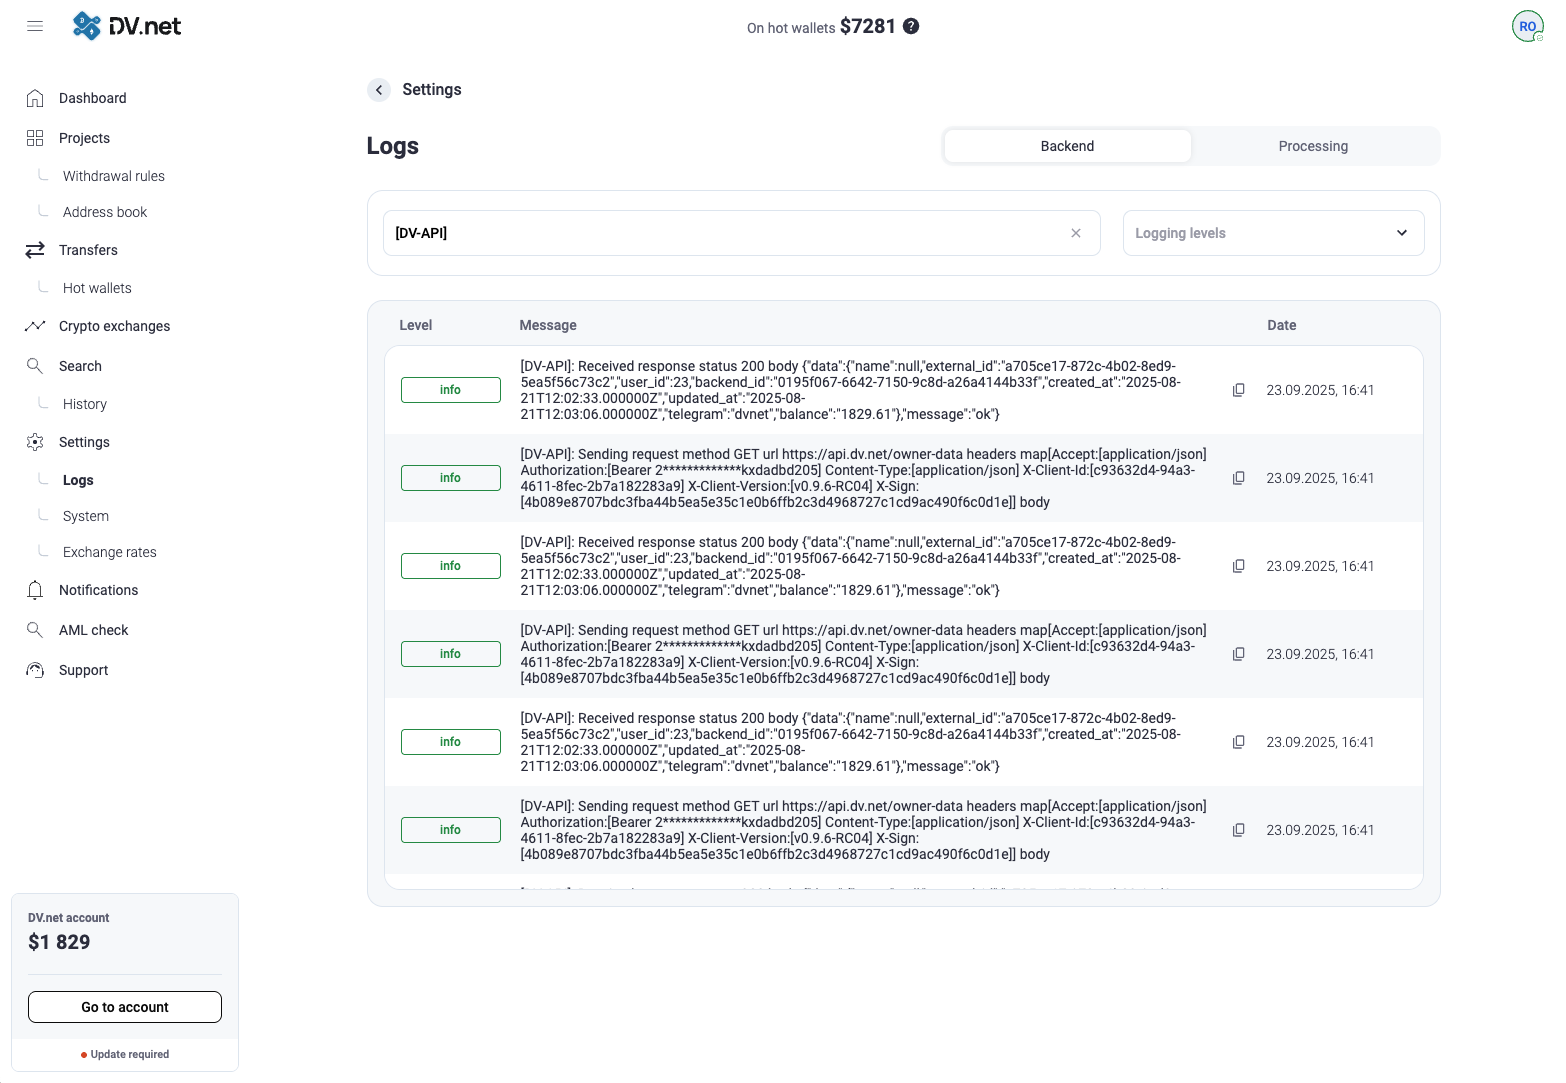
Method 2: Web Application Interface
Additionally, the last 1000 log entries can be viewed and filtered directly in the web application interface:

Advanced Log Collection Setup
Integration with Promtail + Loki + Grafana
yaml
# /etc/promtail/config.yaml

scrape_configs:
  - job_name: dv-merchant
    static_configs:
      - targets:
          - localhost
        labels:
          job: dv-merchant
          __path__: /var/log/dv-merchant/*.log
Logstash Configuration
ruby
input {
  file {
    path => "/var/log/dv-merchant/api.log"
    start_position => "beginning"
    sincedb_path => "/dev/null"
  }
}

filter {
  grok {
    match => { "message" => "%{TIMESTAMP_ISO8601:timestamp} %{LOGLEVEL:loglevel}.*DV-API.*" }
  }
}

output {
  elasticsearch {
    hosts => ["localhost:9200"]
    index => "dv-api-logs-%{+YYYY.MM.dd}"
  }
}
Grafana Alloy Configuration
yaml
logs:
  positions_directory: /var/lib/grafana-agent-positions

  configs:
    - name: dv-merchant-logs
      scrape_configs:
        - job_name: dv-merchant-api
          static_configs:
            - targets: [localhost]
              labels:
                job: dv-merchant
                __path__: /var/log/dv-merchant/*.log